
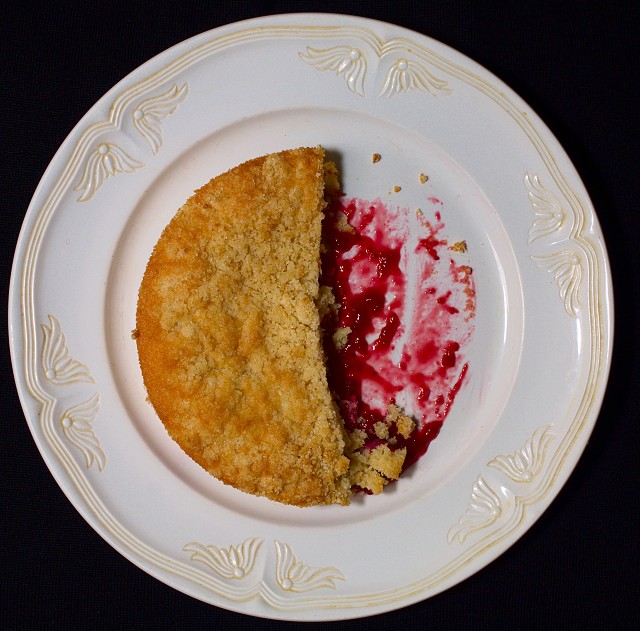
Pie chart
This is my 100th blip. When I started I was unsure as to whether I would keep this going day after day, but I endeavoured to give it a try. Now is an appropriate time for a reckoning, a performance self assessment - no, no, no this is not work and I do not have to justify blip to the bean counters in the execosphere! I have enjoyed sampling blipworld - the photographs of the ordinary (made to look extraordinary), those from faraway places that I would otherwise have never seen, the commentaries, the comments, the ideas and inspiration to look afresh at what is around me and once in a while try something new.
So what does the pie chart represent? Is it
A:
Pie eaten - Percentage of b&w photos blipped
Pie uneaten - Percentage of colour photos blipped
Crumbs - Margin of error
B:
Pie eaten - Number of subscribers
Pie uneaten - Number of subscriptions
Crumbs - My worthwhile blips
or C:
Pie eaten - Mmmm...pie
Pie uneaten - Mmmm...pie
Crumbs - Mmmm...pie
279
views
- 0
- 0
- Nikon D5000
- 1/33
- f/8.0
- 20mm
- 200
Comments
Sign in or get an account to comment.


